- SEO
- Rank Tracker
- Local SEO
- Mobile SEO
- Link Manager
- Landing Pages
- Social Signals
- On-Page Optimization
- Enterprise SEO Solutions
- Marketing
- Competition Analysis
- Insight Graph
- Keyword Research
- Graphs & Widgets
- Market Reach
- Marketing KPI
- Brand Visibility
- White Label SEO
- Marketing Dashboard
- Client Dashboard
- PDF Reports
- PDF Templates
- Other
- Email Notifications
- Portfolio Management
- Integrations
- Google Analytics
- Search Console
- Pay Per Click
- WeDevelop
- API
Rank Ranger Blog
Insight Graph: Free-Form SEO Metrics
December 29, 2014 |
Posted by
Rank Ranger
- Would it include rank, average rank, domain backlink metrics, Google Analytics traffic data, social signals, landing page metrics or visibility score? Maybe even an option for blended metrics all in one graph? And rank or average rank by category?
- Perhaps the freedom to create some graphs for specific search engines and device types, and others with all search engine and device type data combined?
- How about the ability to view comparative data for a custom date range and have it display on a separate axis?
- Should the graph display your data in an area, column, curved line or line style, and with or without markers and labels? And if you would add labels, what is the perfect font size?
- Would the ability to choose from a spectrum of colors be an important graph element?
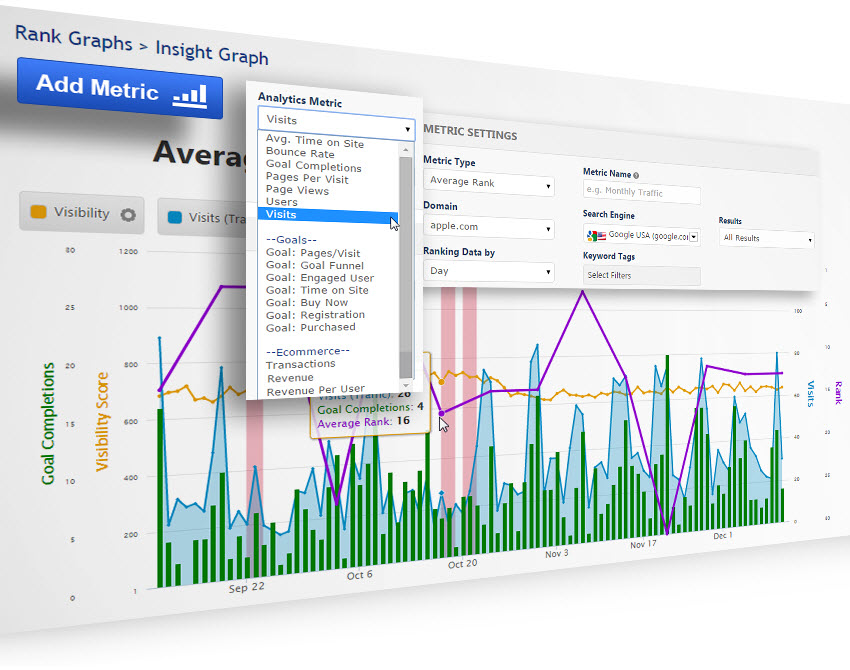
Ladies & Gentlemen, Choose Your Metrics!
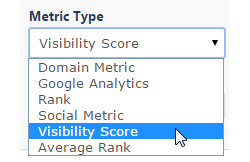 We've provided you with a tool set that we believe contains all the SEO metrics and filters you need to create comprehensive and attractive graphs to showcase your achievements.
- Average Rank
- Domain Metrics
- Google Analtyics
- Rank
- Social Metrics
- Visibility Score
Average Rank Metrics
Average Rank settings include choice of primary or competitor domain and search engine. Once you've made that choice, data can be filtered for keyword categories (tags), Top 10 to Top 100 results, and ranking data by day, week or month.
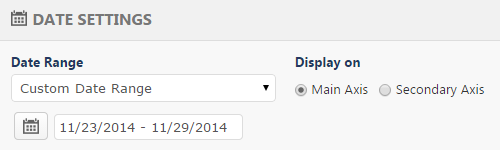
 In the above example, I've opted to compare the current average rank to that of the same time last year and displayed it on a secondary axis. Other date options include comparing to previous period (e.g., October through December, compared to July through September) or entering a custom date range.
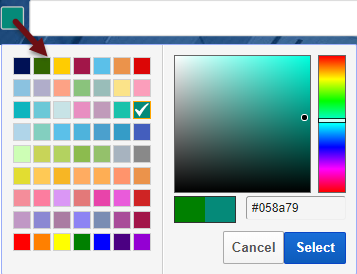
Graph lines can be displayed in any color by selecting from the standard palette, sliding the color bar and dragging the dot, or entering a Hex color value. There are also settings for line thickness, marker size and type, and label font size.
Average Rank can be displayed alone in a graph or you might want to mix it with other metrics like Backlinks, Visibility, Google Analytics data, etc. and you can choose to show or hide the value labels.
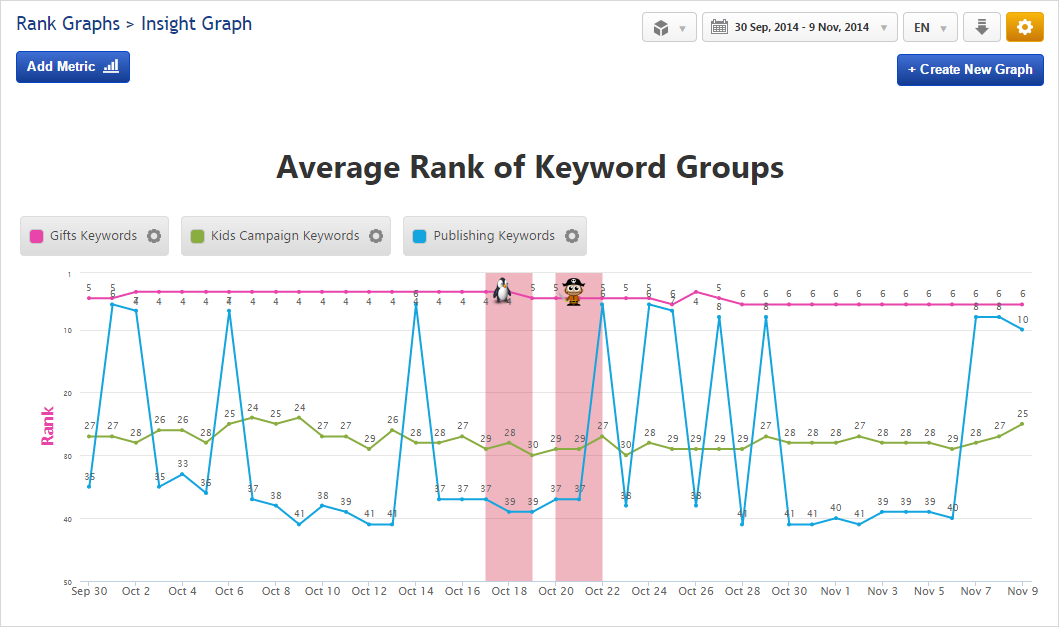
Average Rank of Keyword Groups
This is accomplished by tagging keywords into common categories and then filtering the graph by tag. This feature is especially helpful for visually displaying rank progress for campaigns with a large number of keywords. If your keywords have already been added to Rank Ranger, you can add tags individually or import a new spreadsheet with keywords and tags to update the existing data (refer to the Keywords section of SEO Campaign Setup for the details on how to do this).
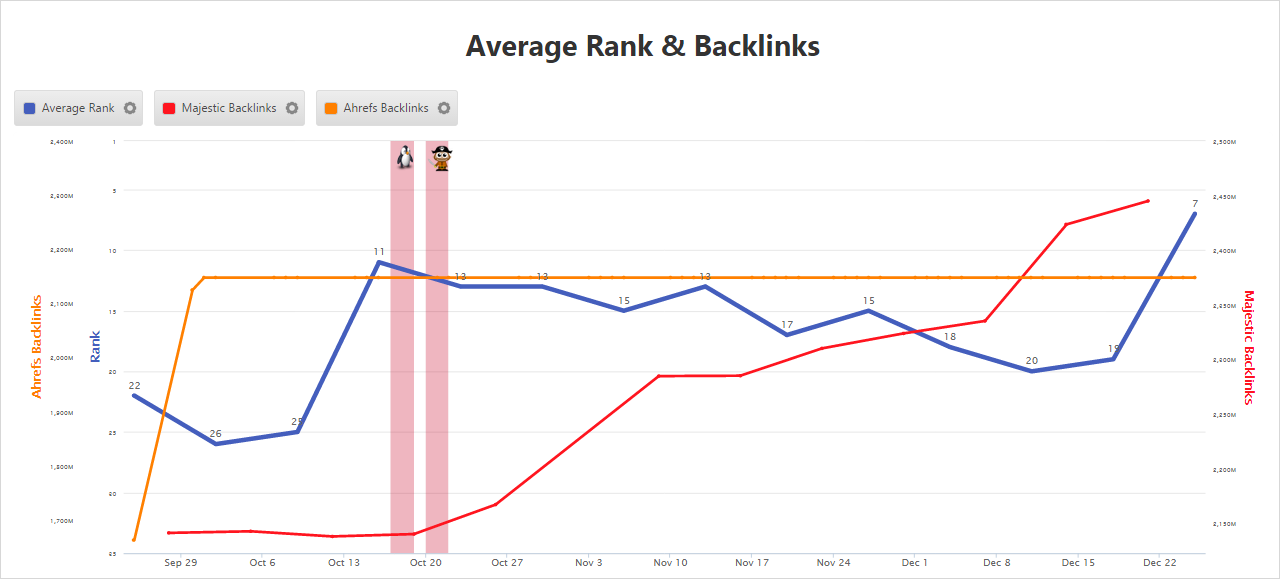
Average Rank & Backlinks
In this example, labels are displayed for Average Rank, but not Ahrefs and Majestic Backlinks, and I've made the Average Rank line thicker than the others.
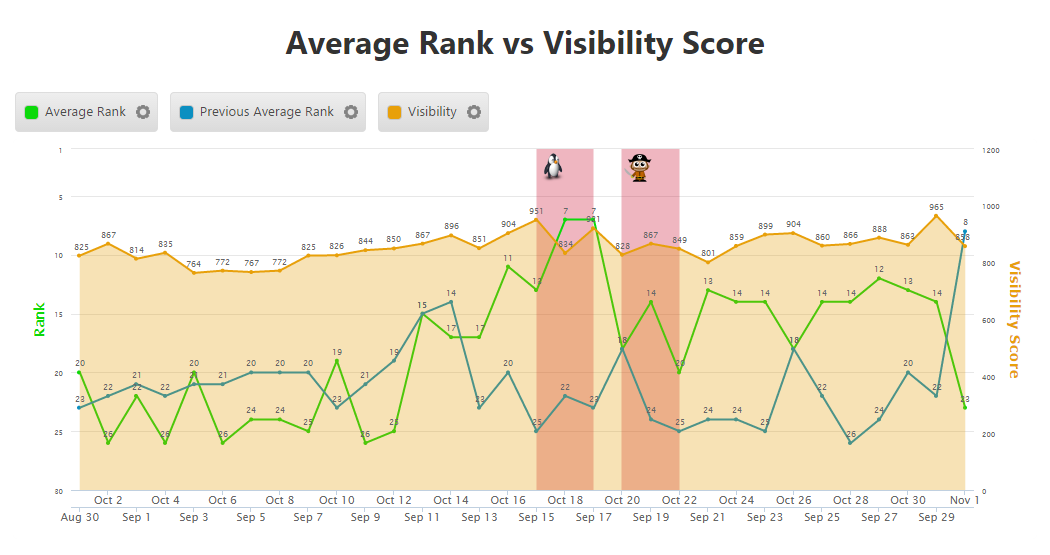
Average Rank & Visibility Score
Here we're viewing Average Rank compared to previous period, along with the Visibility Score for the current period.
Domain Metrics
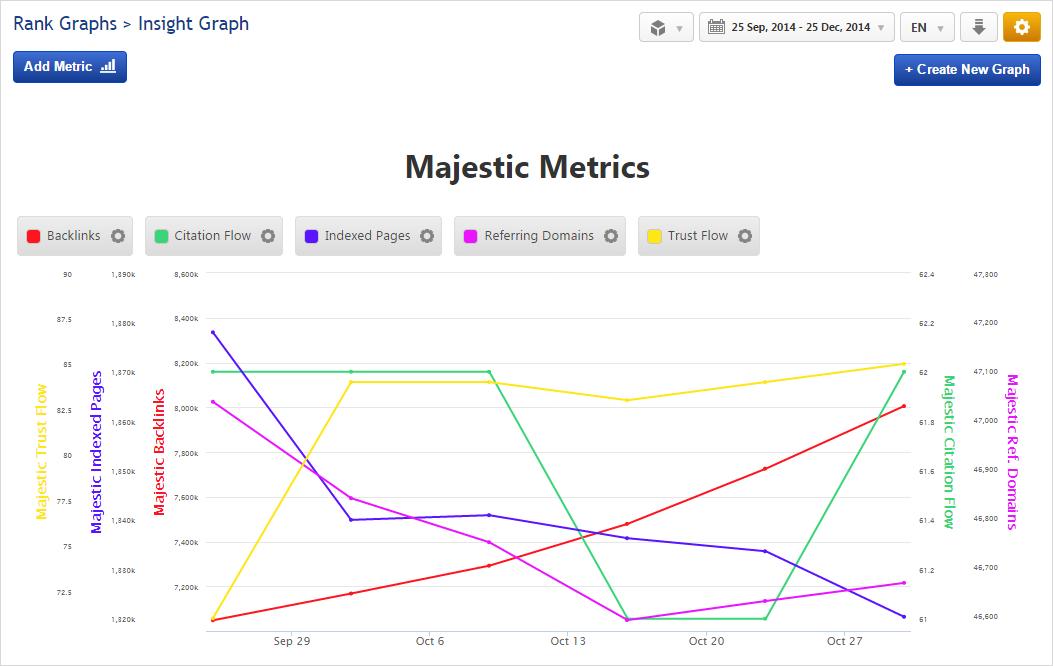
Using the Domain Metric is easy, simply select the domain and one of the following metrics:
- Ahrefs Backlinks
- Ahrefs dofollow
- Ahrefs nofollow
- Alexa Rank
- Delicious Bookmarks
- Majestic Backlinks
- Majestic Citation Flow
- Majestic Indexed Pages
- Majestic Referring Domains
- Majestic Trust Flow
Add a single metric or a variety of Domain Metrics, or think outside of the box and blend with other metric types.
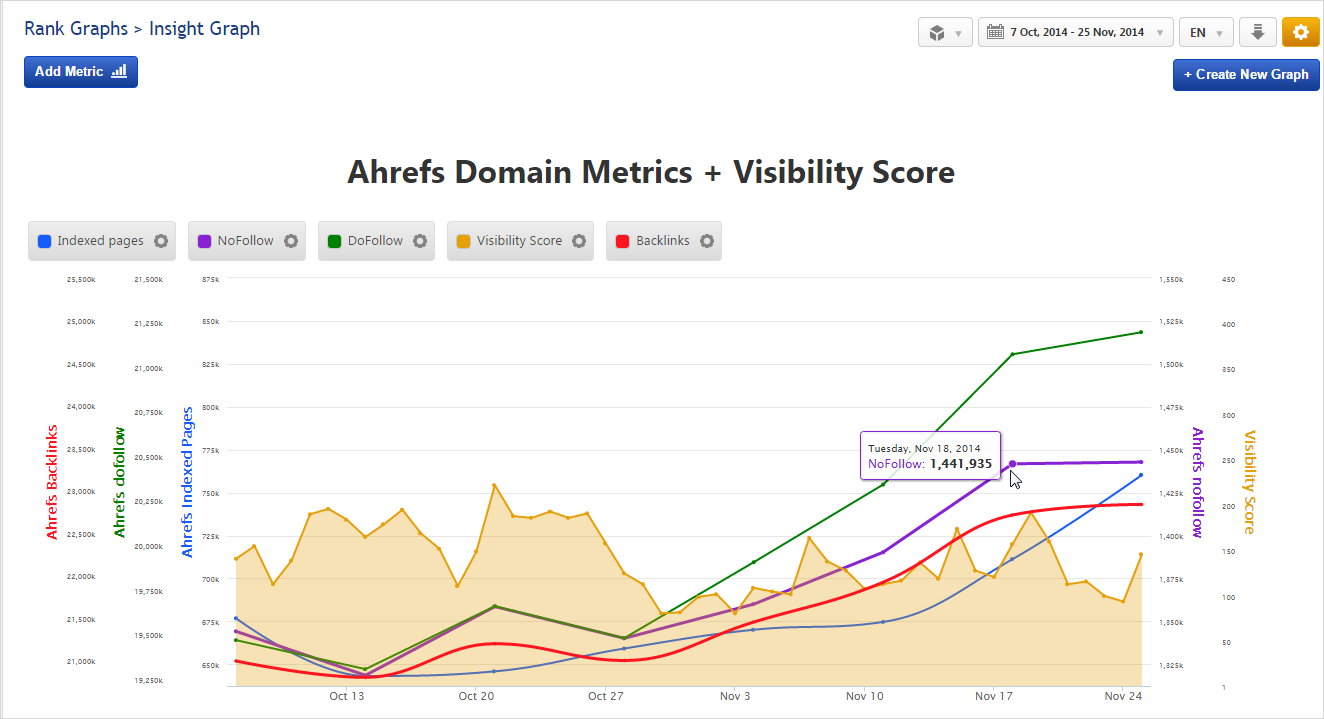
Ahrefs Domain Metrics & Visibility Score
In this example we're displaying Ahrefs domain metrics and have switched our metric hover to the single metric option. Combined hover displays data of all graph metrics for the point on the graph that you hover over, and Single displays only hover point data for the single metric.
Combined Single
We've also added our Visibility Score which is based on the position of ranking keywords and average search volume.
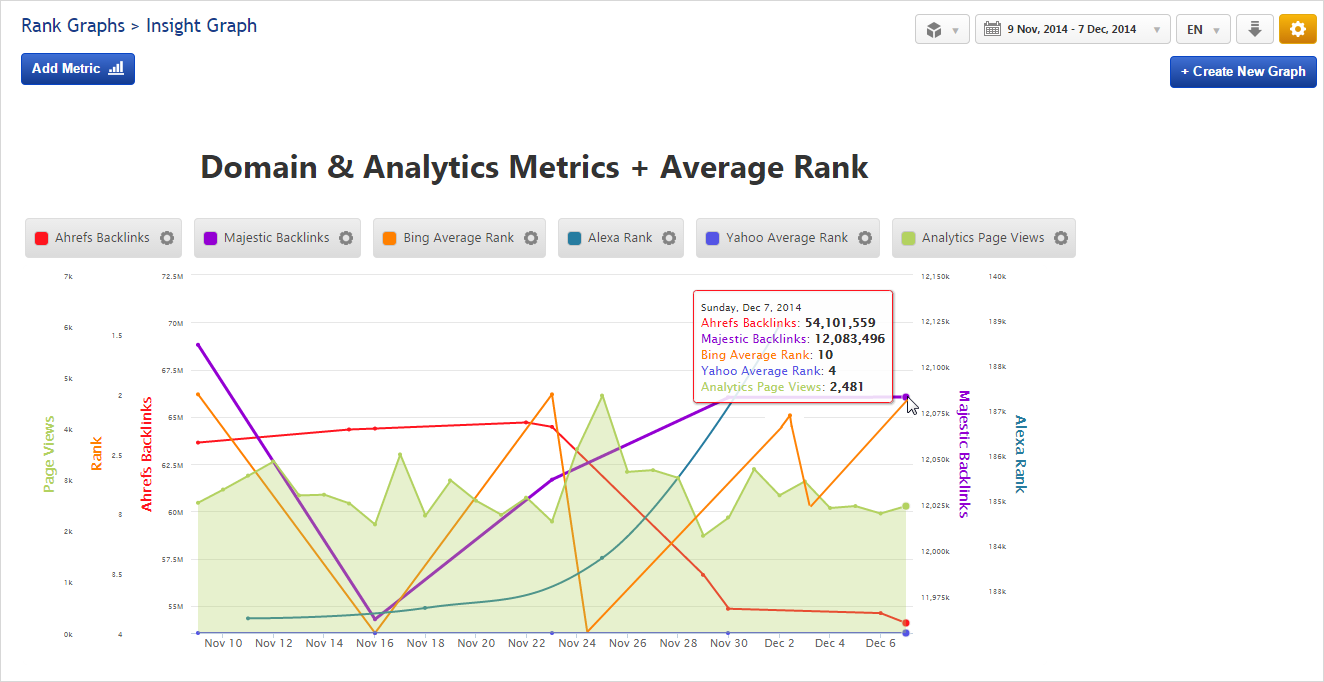
Domain & Analytics Metrics Blended with Average Rank
Domain Backlink and Alexa Rank metrics have been blended in this graph with Analytics Page Views and Bing & Yahoo Average Rank for this campaign. Note that we've switched the metric hover to the Combined setting for this graph.
Google Analytics Metrics
If your campaign is connected to a Google Analytics profile, you can create a graph using Analytics traffic, goal conversions and e-commerce tracking metrics including:
- Average Time on Site
- Bounce Rate
- Pages Per Visit
- Page Views
- Users
- Visits
- Goal Completions (total)
- Goal Completions (specific)
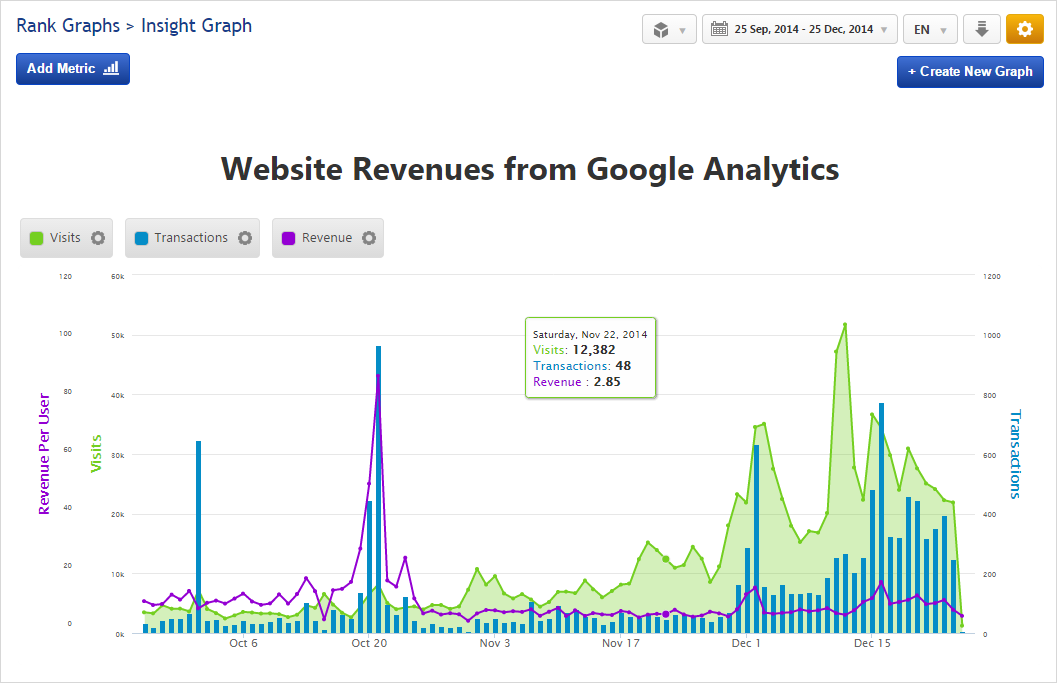
- Transactions
- Revenue Per User
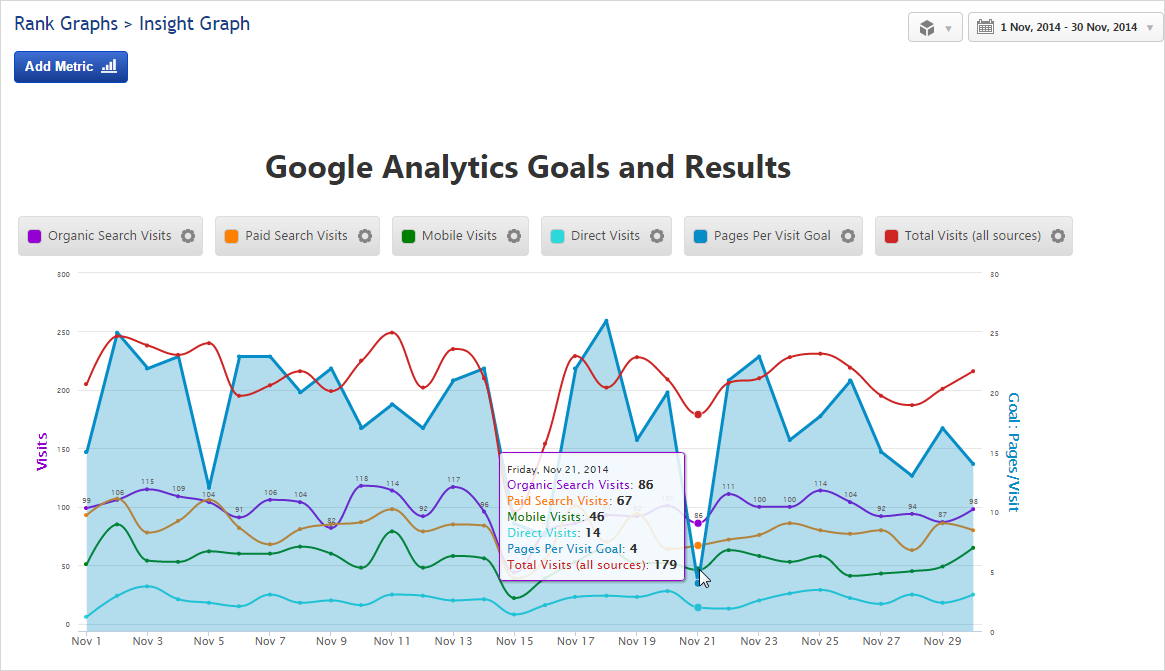
Google Analytics Goals and Visits
Select an Analytics metric and filter data by Traffic Source, Device type and/or Browser. In this example we've added 5 Visits metrics: Total Visits from all sources, Organic Search Visits, Paid Search Visits and Direct Visits, plus we filtered All Visits from Mobile Devices, and included Goal Conversion results.
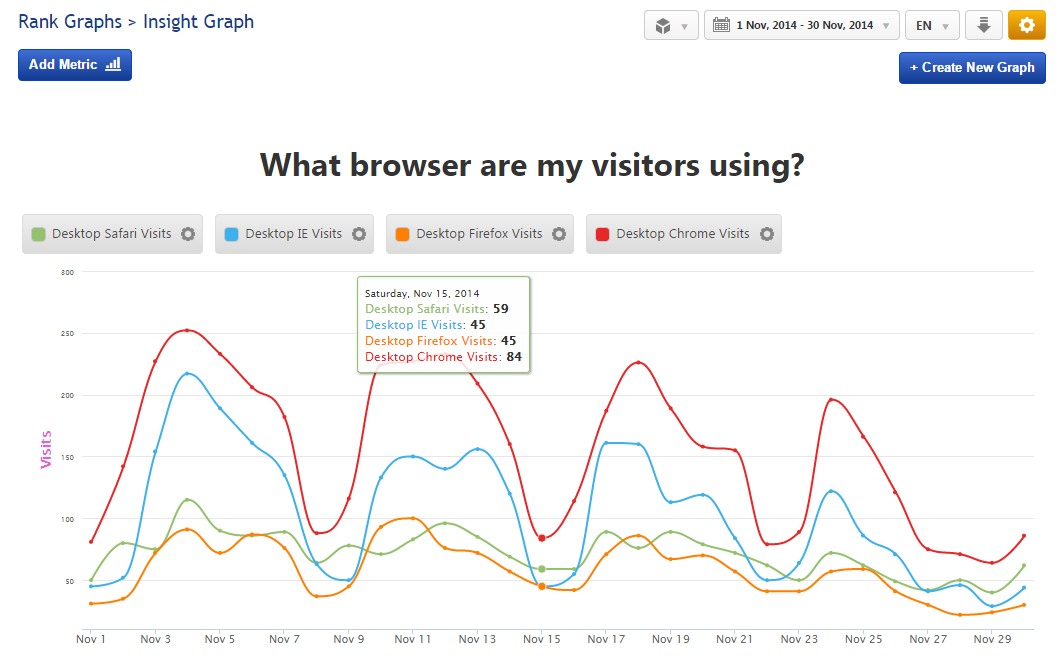
Analytics Traffic by Browser Type
Browser updates have been known to prevent users from enjoying interactive website features occasionally, so we thought it would be helpful to enable settings that allow for the creation of a graph displaying the browsers being used to view your campaign's primary domain.
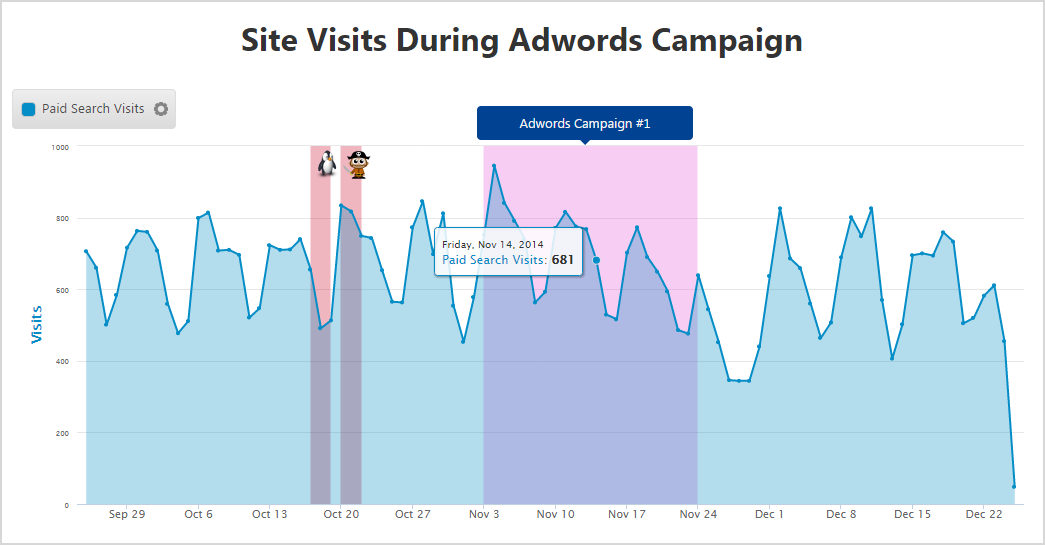
Site Visits and AdWords Campaign Notes
Events & Notes can be added to Insight Graphs in the same manner they're added to many ranking reports. In this example, we've added an Event to highlight an AdWords campaign over a graph of paid search visits. The cute, innocent looking Penguin, smiling Pirate and cuddly Panda are displayed depending upon whether a Google Algorithm update took place during the time frame the report dates span, and if Algorithm Change is set to Show in the Rank Risk Index section of the Report Options.
Rank Metrics
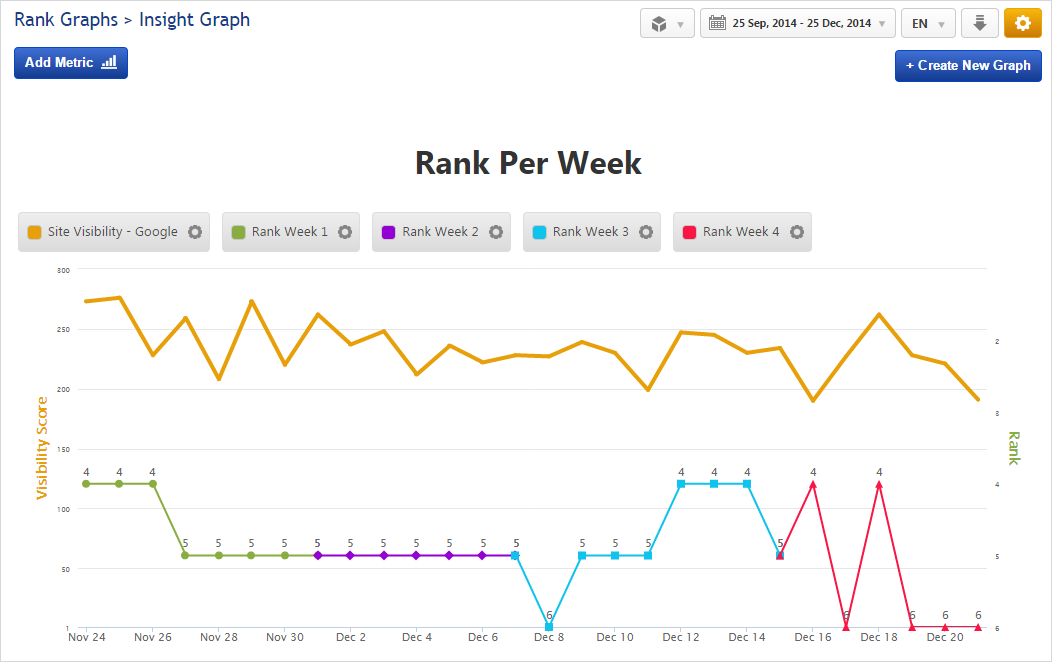
Dare to be colorfully creative! The above graph displays rank for the same keyword over a 4-week period using different colors and markers to visually differentiate between the time periods. This was accomplished by creating the 4 Rank metrics each with it's own custom date range and displayed on the same axis.
Choose a domain and keyword and your rank data can be filtered by:
- Search Engine
- Results from Top 10 to Top 100 or all (up to 500 depending upon the search engine selected)
- Monthly, Weekly or Daily ranking results
Daily Target Keyword Rank vs. Daily Site Average Rank
When marketing for a few target Keywords you could add their individual rank to an Insight graph alongside average website rank and include Notes detailing specific marketing activities. In this graph we can see that "Holiday Barbie" jumped from position #3 to the #1 rank position during the 5 days that an advertisement was running and then fell back to the #3 position.
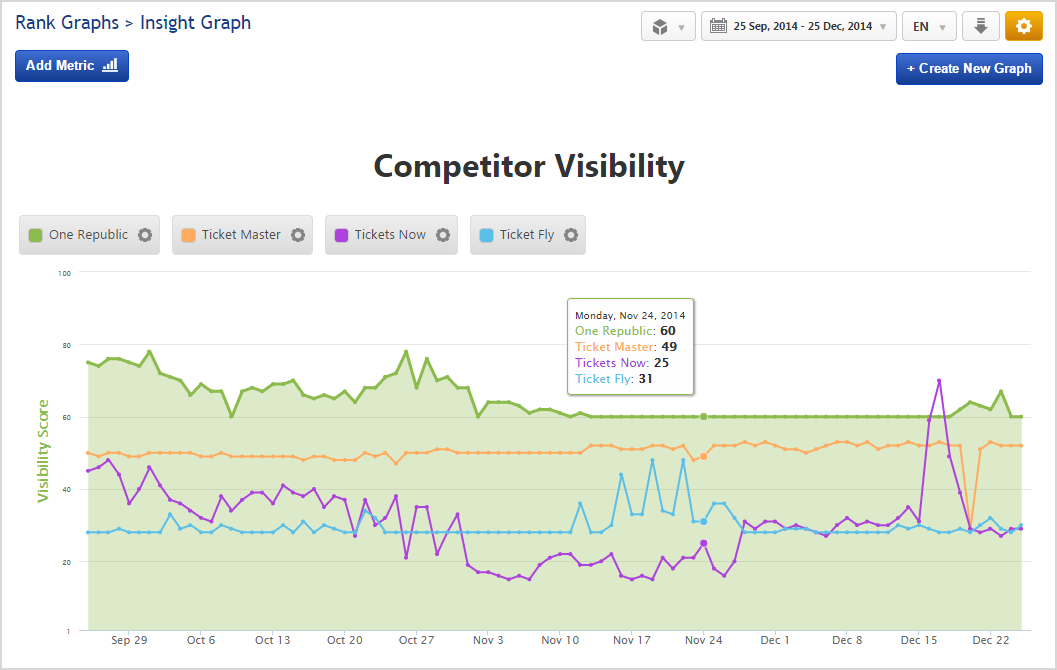
Rank & Competitor Rank on Multiple Search Engines
Pick a Keyword and plot it on the Insight Graph for multiple search engines and then do the same for a competitor's site to determine how well (or poorly) the site you're managing is ranking against the competition.
Note in this example that legend metric labels are drag & drop so you can reorder them the way you want them displayed. Just make sure you click that Apply Changes link to save that order.
Social Metrics
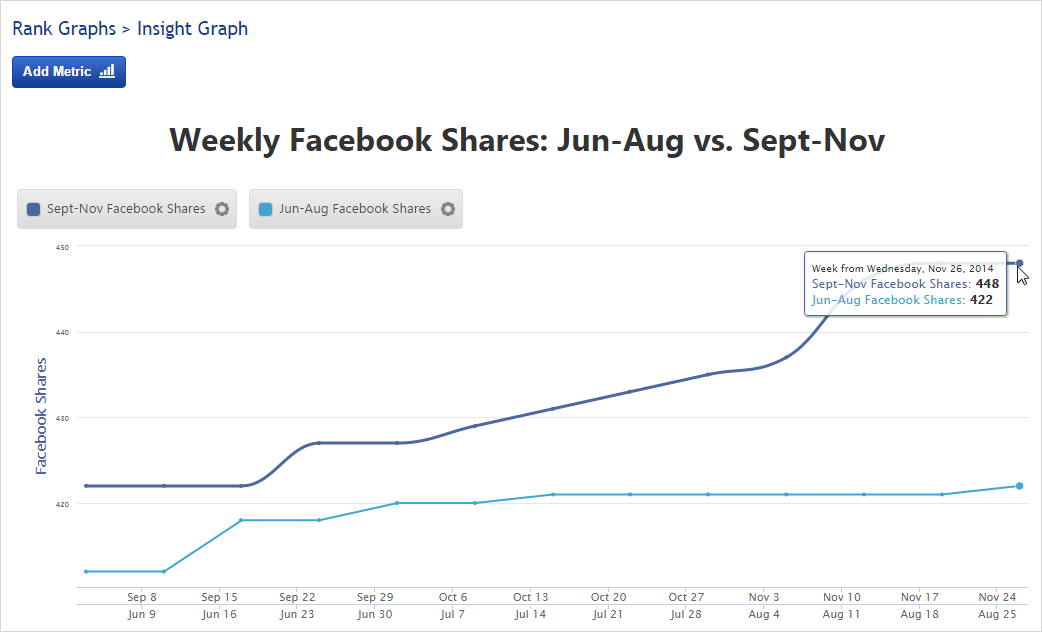
Social Metrics can be compared over time as in the above example where we've compared Facebook Shares from September through November to those from June through August using a secondary axis, or they can be graphed in a number of other ways.
Social Signals are collected weekly for your ranked landing pages on 8 social media platforms:
- Delicious
- Facebook Clicks
- Facebook Comments
- Facebook Likes
- Facebook Shares
- Facebook Total
- Google+
- Stumbleupon
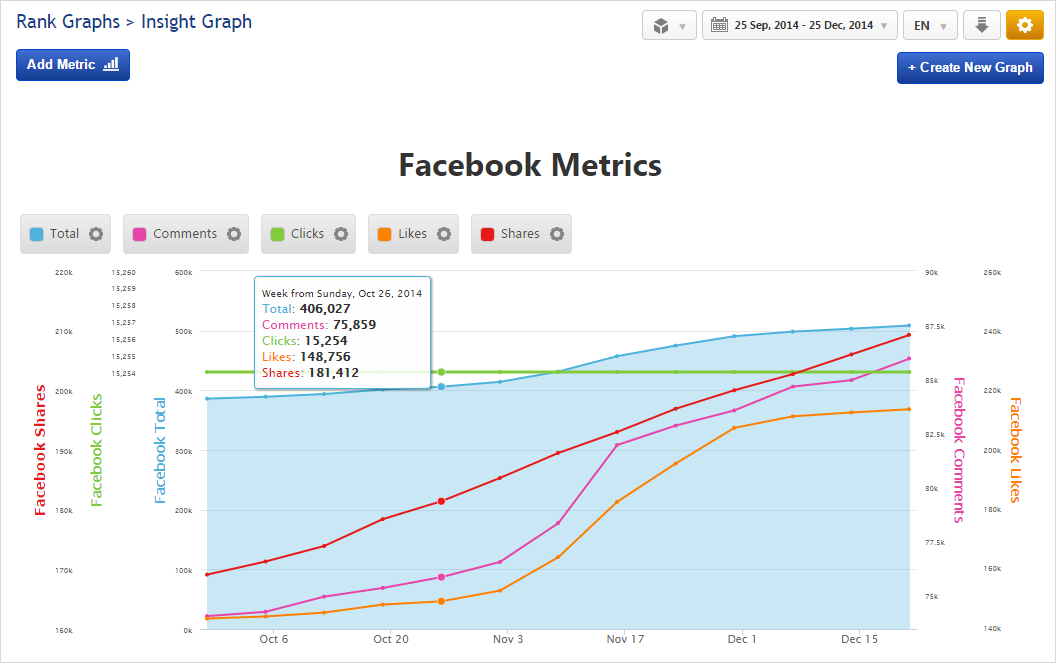
Facebook Metrics
Gain Facebook insights by graphing Total activity along with Likes, Shares, Clicks and Comments.
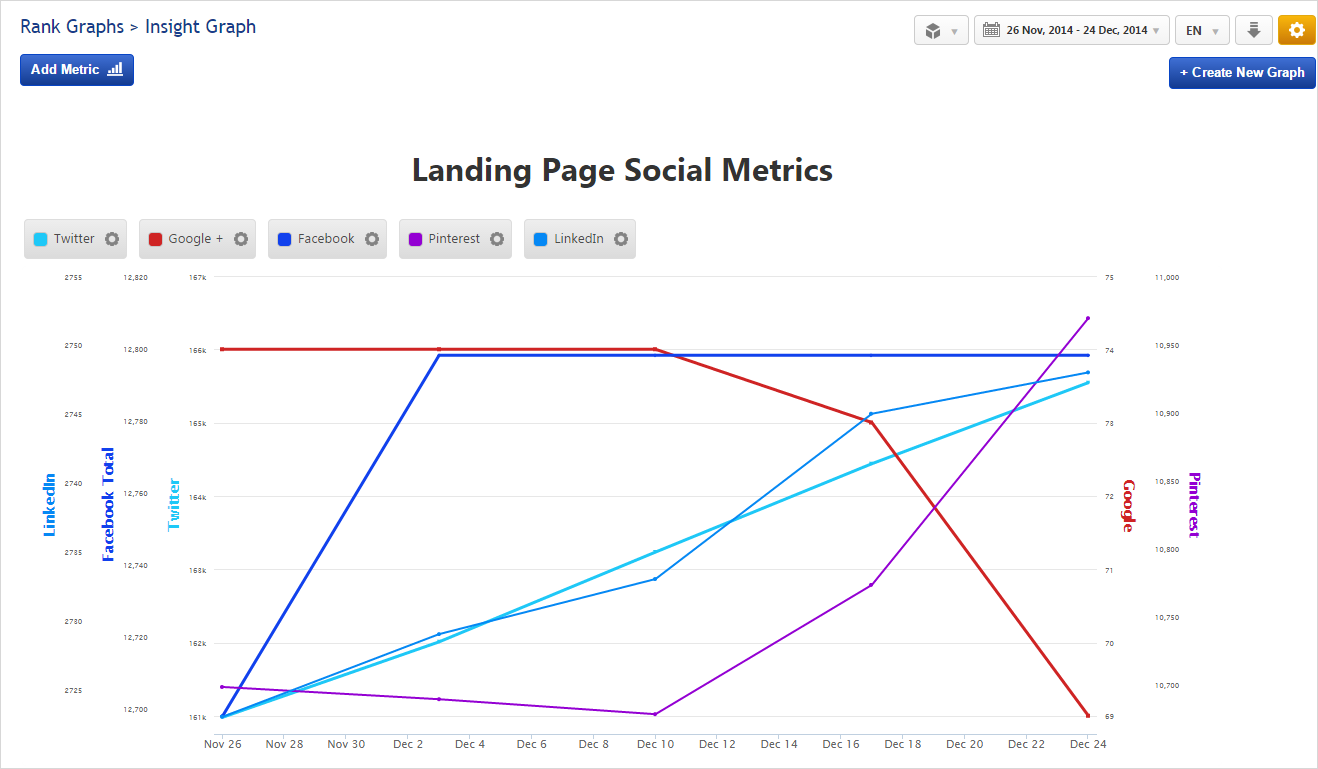
Landing Page Social Metrics
Mix Twitter, Google+, Facebook, Pinterest and LinkedIn for a blended picture of social media engagement.
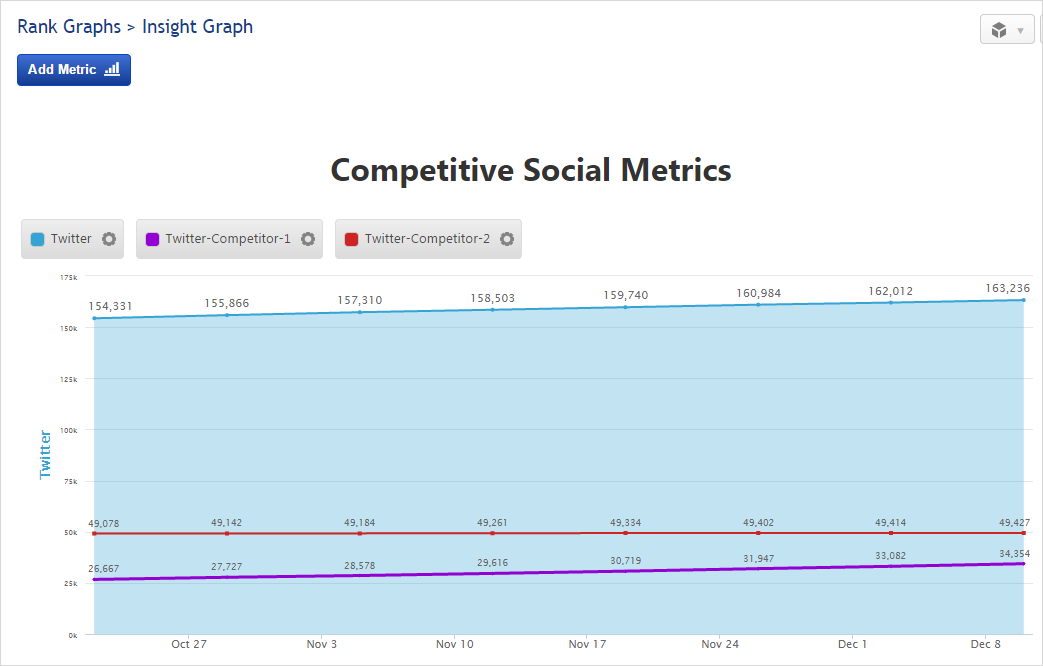
Competitive Social Metrics
Curious about how the competition stacks up on Twitter or any other social network? Add a few metrics to the Insight Graph for a quick report that you can share with management or clients.
Visibility Score
Visibility is based on the position of ranking keywords and average search volume. The Visibility Score takes into account all tracked keywords for a website, but can filter the results by selecting a specific search engine and keyword tag.
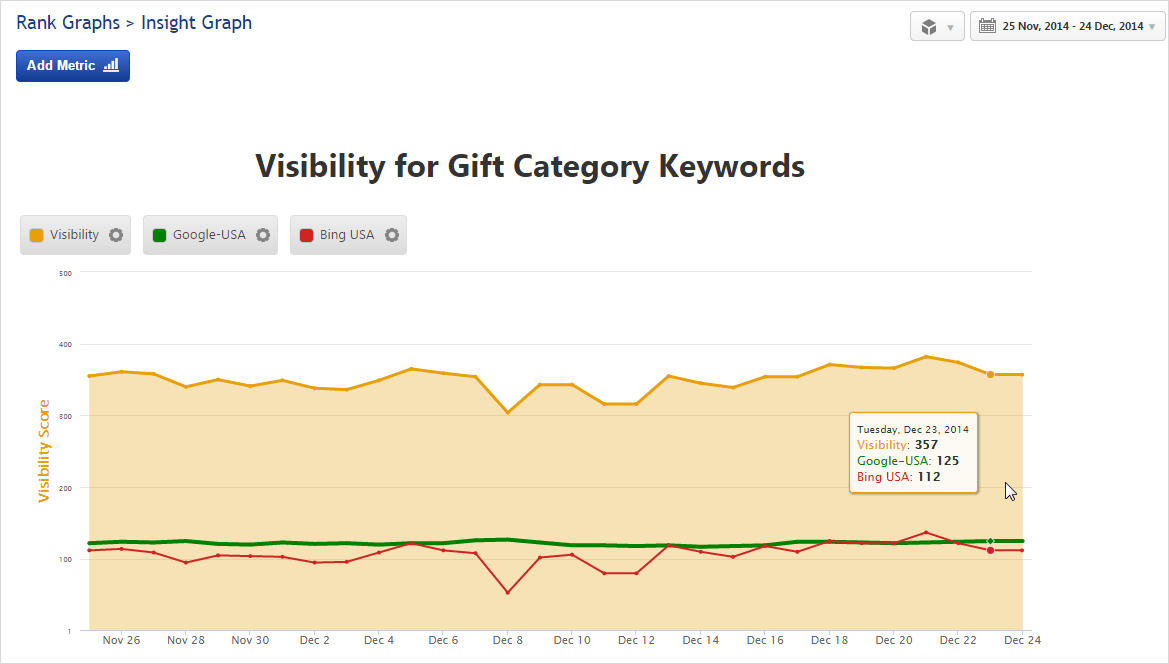
Visibility by Keyword Category
Here we've selected the Visibility Score metric for a Keyword category and then added the Visibility Score for that group on Google USA and Bing USA for comparison.
Blended Metrics
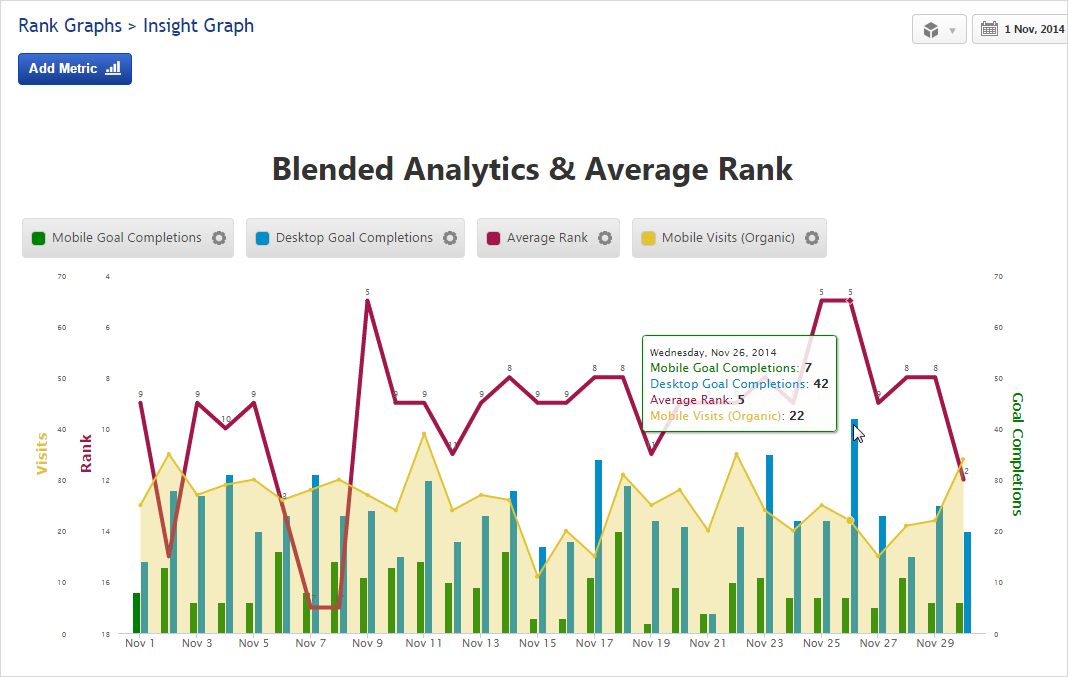
I think that the true beauty of the Insight Graph is the ability to create reports with blended metrics. In the above example we've got Average Rank and Mobile vs. Desktop Goal Completions set against a backdrop of Organic Mobile Visits. This is one of many examples of blended metrics that I've shown you in this post, I'm interested to learn which metrics you might add to an SEO graph.
Presets
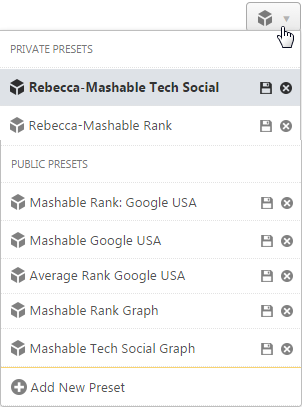 With all these metrics and filtering options available, we realized that you might want to have more than one version of an Insight Graph for a particular campaign, and so we created Report Presets. This feature allows you to save a personalized version of an Insight Graph and create additional versions with different metrics, variables and styles of that graph for the same campaign.
Since many of you take advantage of our team-based platform and have Sub-Users sharing your account, we enabled both Public and Private Presets. You can learn more about this feature in our recent blog post titled Save Multiple Personalized SEO Report Versions with PRESETS. If you do have other people using your account and have not yet set them up as Sub-Users, we recommend that you do so in order to take full advantage of this feature (refer to our Manage Sub-Users documentation).
A Big Thank You!
We'd like to publicly thank each and every customer who participated in this WeDevelop project and assisted with beta testing, but since they're using our White Label features to provide automated PDF reports and branded web interfaces to their clients, we can't do that here. You know who you are and you have our warmest regards and appreciation for your collaborative efforts in helping us bring the Insight Graph from wishlist to reality!
Limitations of the Insight Graph
The Insight Graph is limited only by your imagination, so I invite you to log in and create some awesome graphs (access our documentation for illustrated step-by-step instructions). If you create one (or many) that you're especially proud of, please send a note to service@rankranger.com with the Campaign Name and Preset so we can enjoy and share in your success.


Rank Ranger Updates
Similarweb Search Volumes Are Now in Rank Ranger
January 4, 2023
Announcing the Rank Ranger Google Analytics 4 Integration
August 10, 2022
A New Beginning with Similarweb: How Our Customers Will Benefit
May 25, 2022
Core Rank Tracking - A Local Enterprise SEO Tool
November 3, 2021
Announcing The SERPulator: A Free Meta Tags Preview Tool!
March 10, 2021
Subscribe & Receive Updates