- SEO
- Rank Tracker
- Local SEO
- Mobile SEO
- Link Manager
- Landing Pages
- Social Signals
- On-Page Optimization
- Enterprise SEO Solutions
- Marketing
- Competition Analysis
- Insight Graph
- Keyword Research
- Graphs & Widgets
- Market Reach
- Marketing KPI
- Brand Visibility
- White Label SEO
- Marketing Dashboard
- Client Dashboard
- PDF Reports
- PDF Templates
- Other
- Email Notifications
- Portfolio Management
- Integrations
- Google Analytics
- Search Console
- Pay Per Click
- WeDevelop
- API
Rank Ranger Blog
All-New Google My Business Reports Inside Rank Ranger!
October 23, 2018 |
Posted by
Rank Ranger

You've asked for it, and you got it .... a prolific set of Google My Business reports are now available inside Rank Ranger! While you've been able to access Google My Business data as part of your Yext integration for some time, now you can directly access the data via some really deep and really colorful reports (who doesn't love color?).
In fine Rank Ranger tradition, there are numerous and highly customizable ways to dig into your Google My Business data. Let's go for a tour!
A Vivid Dashboard of Google My Business Insights
One of the unique things about Google My Business data is that it's often applicable to small businesses, who may, or may not be familiar with the metrics and information found in Google My Business. Reporting your progress to these clients can, of course, be a bit tricky. That's why we created a dashboard of data that is undeniably focused on clear, easy to comprehend, visually-based data.

The Google My Business Overview report contains a series of widgets and bar graphs colorfully designed to offer you local SEO insights in an easy to follow manner. The report offers insights into the following metrics:
- Direct vs. Discovery
- Search Maps and Views
- Customer Actions
- Calls by Day & Hour
- Photo Quantity & Views
- Local Posts Performance
In order to clarify the data being presented, the above metrics are displayed under titles that are user-friendly and intuitively understood. For example, instead of showing data on how customers utilize
Breaking Down the Widgets Found in the Google My Business Overview Report
As mentioned, each section of the Overview report contains a cumulative chart accented by a graph presenting a per day breakdown, to the exclusion of the Calls by Day & Hour element. Here's a quick look at the data you can access in each report section:
How customers search for your business
Here the pie chart offers a breakdown that covers the entire selected date range and shows how many customers came to your site via search and how many came by typing your URL into the browser. You can access exact figures by either hovering over the pie chart or by looking at the graph's legend.

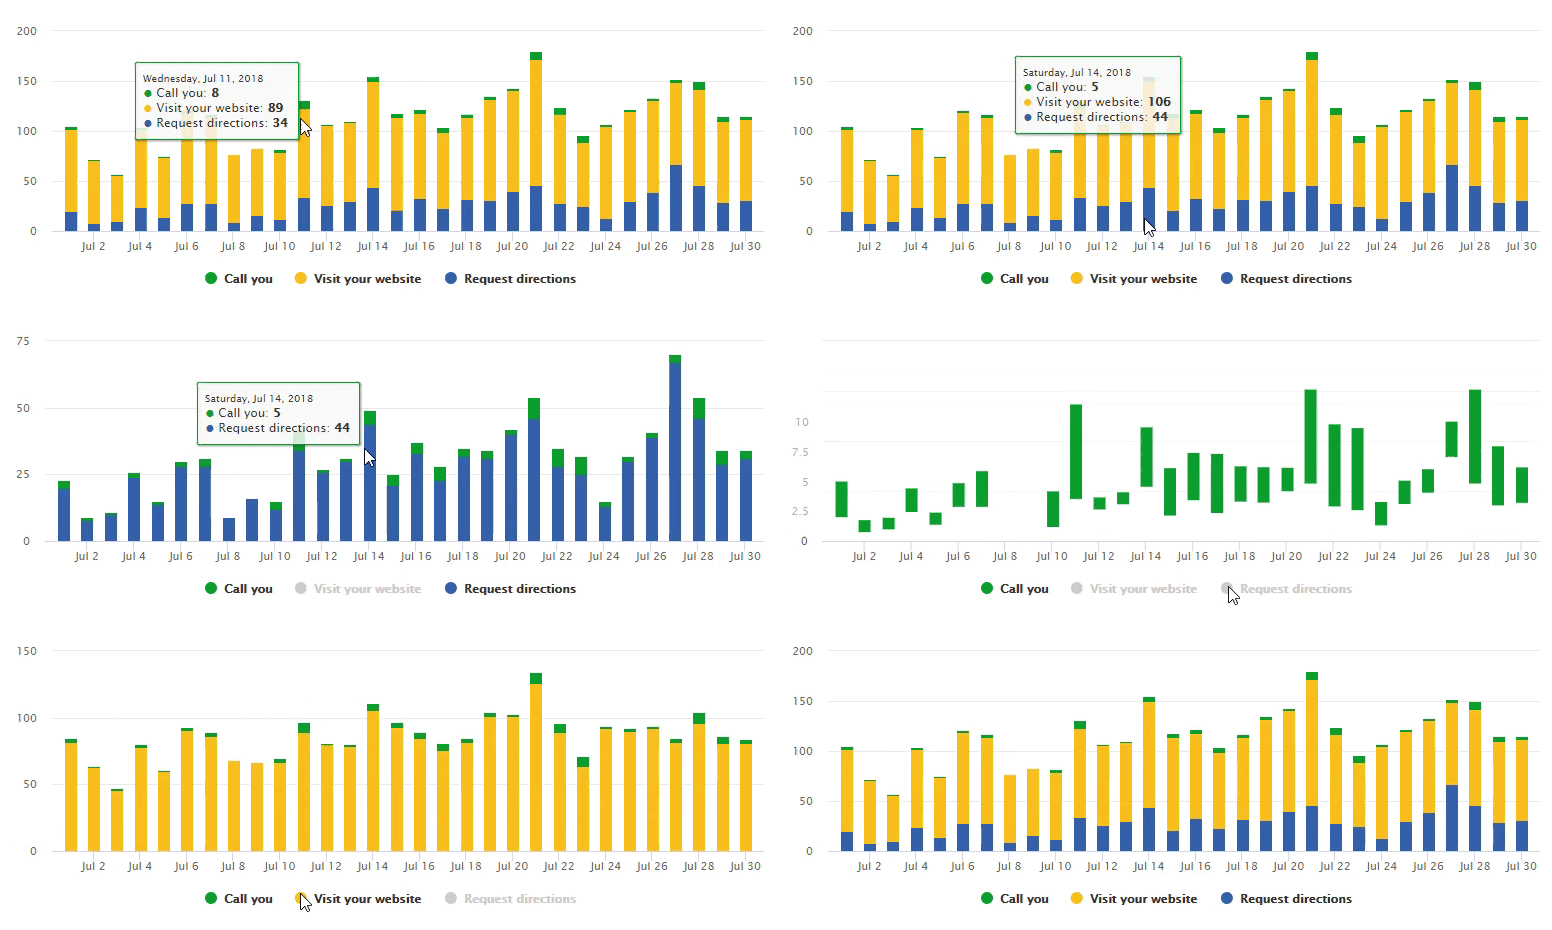
To the right of the pie chart, you will find a bar graph that breaks the data down per day. Here, you can select to either include or exclude any of the metrics from displaying by clicking on the metric labels found below the graph.
Where customers view your business on Google
This report element shows you the number of instances within the data period where users viewed your business listing on Google Maps as compared to the number of listing views accessed via Google search per se.

As with the Direct vs. Discovery data discussed above, the pie chart offers a cumulative look at the number of Google Maps vs. Google search sourced views. Again, to the chart's right is a bar graph that tells you how many times your listing was accessed via Google Maps and how many times your listing was accessed via Google search.
Customer Actions
The data found within the Customer Actions section of the Overview report gives you insight into how customers interacted with your listing once they found it. Specifically, the data here tells you how many times a user came to your business listing and either called your business, visited your website, or requested directions.

The three metrics can either be analyzed aggregately via the pie
Calls by Day & Calls by Hour
The data here takes on a bit of a different format. As opposed to a pie chart showing aggregate data the report offers you a breakdown of the calls made to your business via your listing according to the day of the week. By way of example, the graph tells you how many calls were made via your listings on all of the Mondays that fell out within the reporting period, and so forth.

The Call by Hour bar graph that shows alongside the day of the week data does the
Photo Quantity and Views
Both business owners and users have the ability to upload photos to a Google business listing. The data within this section of the report tells you the proportion of both within a specific date range.
Returning to the pie graph format, the report gives you a total of both the number of customer and owner photos found within the listing as of the last day of the date range selected.

Accenting this data is a breakdown of how many views these photos have received. The views are segmented by views accrued by business owned photos and views garnered by photos users had uploaded.
Local Posts Performance
One of the most advantageous tools a local business can capitalize on is Google Posts. Via the feature, a business can showcase their own content right on the SERP. What's more, these posts can contain any one of various calls to action that Google offers.

To track your post's performance you can see the number of total views you have accumulated during the reporting period. At the same time, we've added a bar graph to indicated how many views your postings have received per day and how many clicks your call to actions have garnered. In the above case, we've deselected the Call to action metric in the bar graph, and are showing just the number of views.
The Google My Business Customer Reviews Report
It goes without saying that reviews are one of the most important elements for a local business facing stiff competition. We all know, good reviews can make a business while bad reviews... well bad reviews are not good.
Seeing, showcasing, and reporting on these reviews is a foundational part of local SEO reporting. What we've done with the Google My Business Customer Reviews Report is give you the ability to see and share your Google reviews. These reviews can be sorted either by date or rating, as well as according to

The reviews found within the report mimics the very format utilized by Google Reviews. Consequently, for each review you have access to the:
- User's name
- Number of stars left by the user
- Review copy
- Date the review was left
- Owner replies
Above the list of reviews is an aggregation that shows the total number of reviews your listing has received along with the average rating represented by the reviews overall.
Custom Created Google My Business Insights
By now you know that we love offering you ways to create custom graphs and datasets. Doing so, of course, enables you to not only show the data you want in the way you
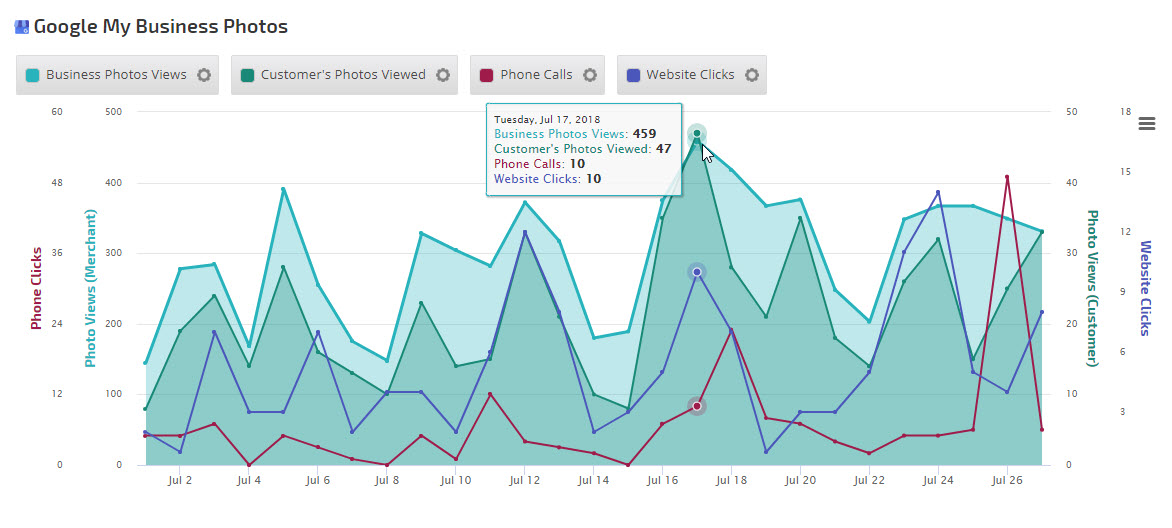
Using the Insight Graph, you can do just that. Not only does the Insight Graph offer you segmented Google My Business data (for example, website clicks) but you can also display insights for any combination of Google My Business metrics. More, and as mentioned, you can compare your Local SEO data to any of the other datasets available in Rank Ranger according to your data and display preferences.

The Insight Graph showing Google My Business data that compares calls, photos, and website clicks according to various display settings
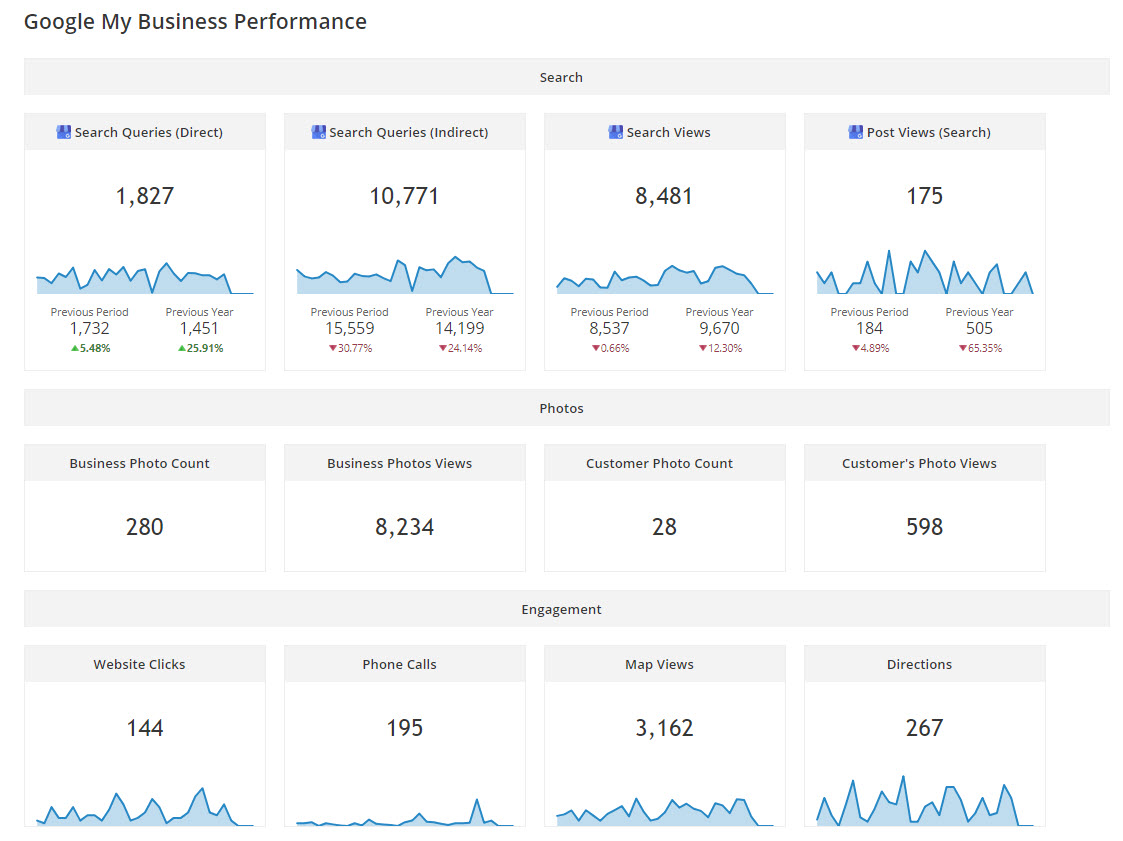
Also available to you are the Metrics Widgets. This tool is perfect for showing a custom set of data that would overwhelm a single graph. The Metric Widgets give you the option to create themed rows of data under a heading and to include a trends graph within each widget (among many other options).

Metric Widgets showing Google My Business data as segmented according to
Share Your Google My Business Advantageously!
One of the most advantageous things about having your Google My Business data integrated into Rank Ranger is the ability to add that data to a white label report. While we offer multiple white label options, such as automated PDF reports or our Client Dashboard, we very much recommend the Marketing Dashboard.
With the Marketing Dashboard, you can use those visually striking charts and graphs to report on your Google My Business performance to clients who may not be extensively familiar with what local SEO consists of. The data inside the dashboard is active, which means the hover effects will be available to your clients.

Sharing Google My Business data within the Marketing Dashboard allows for a substantial way to show your data and communicate with clients all within a 100% white labeled environment
The Marketing Dashboard also means you'll be able to add explanatory notes to your Google My Business data, as well as supplement the data with anything from embedded videos to ancillary insights so as to tell a complete digital marketing story.
Lapping Up Local Google Data

The growing importance of both local search and the integration of a business's digital identity with a brick and mortar presence continues to be a constant. The importance of a well optimized Google Business listing is uncontested. As time goes on, more and more businesses will see the value in their online identity.
As they do, the data within Google My Business will become increasingly part of nearly every business' strategy. As that happens, more and more business owners will want clear and understandable access to their Google My Business
Related Articles
Google My Business Monetization: Putting the Pieces Together
More Facebook, Instagram, Yelp, & Yext Metrics Added to Rank Ranger!
Google My Business Performance Reporting with Rank Ranger
What is Googlebot and How Does It Work?
Using Google My Business Reviews to Promote Your Business
How to See International Google Search Results without a VPN


