- SEO
- Rank Tracker
- Local SEO
- Mobile SEO
- Link Manager
- Landing Pages
- Social Signals
- On-Page Optimization
- Enterprise SEO Solutions
- Marketing
- Competition Analysis
- Insight Graph
- Keyword Research
- Graphs & Widgets
- Market Reach
- Marketing KPI
- Brand Visibility
- White Label SEO
- Marketing Dashboard
- Client Dashboard
- PDF Reports
- PDF Templates
- Other
- Email Notifications
- Portfolio Management
- Integrations
- Google Analytics
- Search Console
- Pay Per Click
- WeDevelop
- API
Rank Ranger Blog
Analyze the Value of Social Engagement in Insight Graph
October 30, 2015 |
Posted by
Michael Lerner
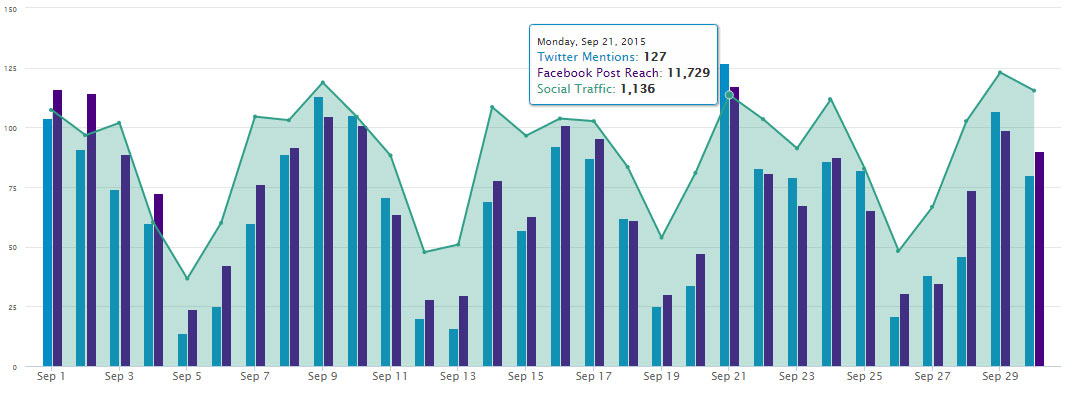
The Insight Graph you see above was made possible thanks to the addition of Social Analytics as a data source. Simply select a type (e.g., Facebook Twitter, YouTube or Instagram) and a list of available metrics populates. In the case of Facebook you can choose from New Likes, Page Check-ins, Fans, Impressions, Stories and Views, People Engaged, Post Clicks, Impressions and Reach, Total Reach and Unlikes.
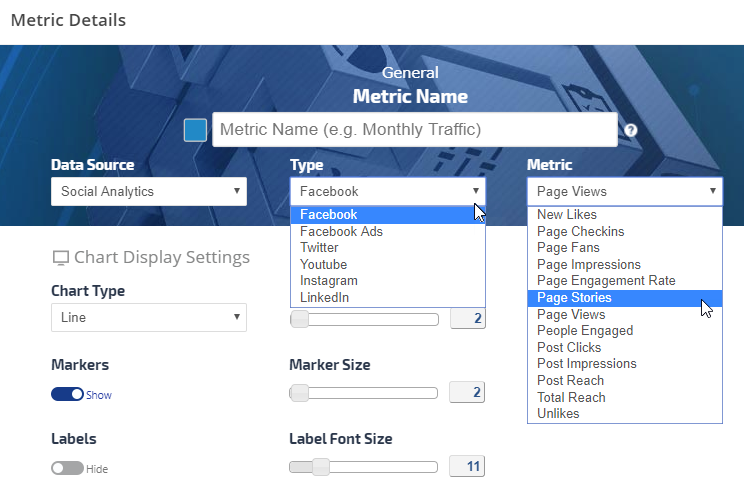
You can add multiple metrics from the same social channel or blend metrics from different channels in the same graph.
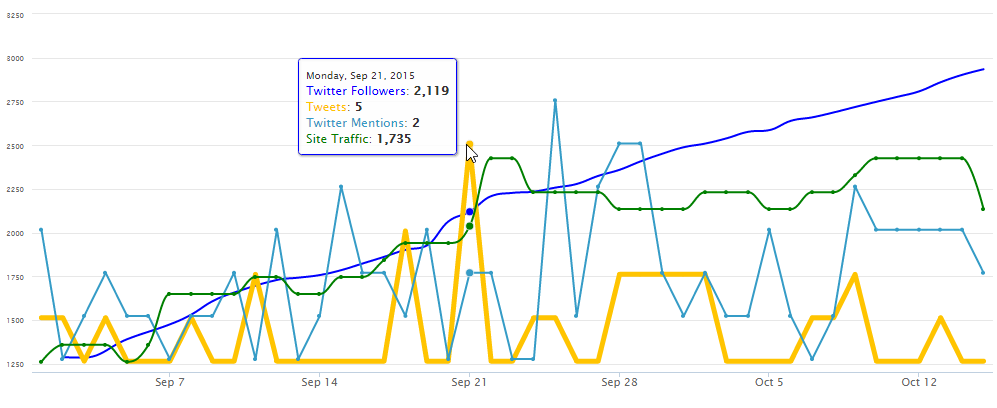
Twitter Insight Graph
Choose from Twitter KPIs such as Tweets, Retweets, Replies, Favorites Gained, Retweets Gained, Mentions (plus Mentions: Reach, Replies, Replies Reach, Retweets & Favorites), and Lifetime Followers, Following, Favorites, Tweets and Lists
YouTube Brand Channel Performance
YouTube metrics include Likes, Comments, Dislikes, Earnings, Estimated Minutes Watched, Favorites Added, Favorites Removed, Shares, Views, Subscribers Gained, and Subscribers Lost
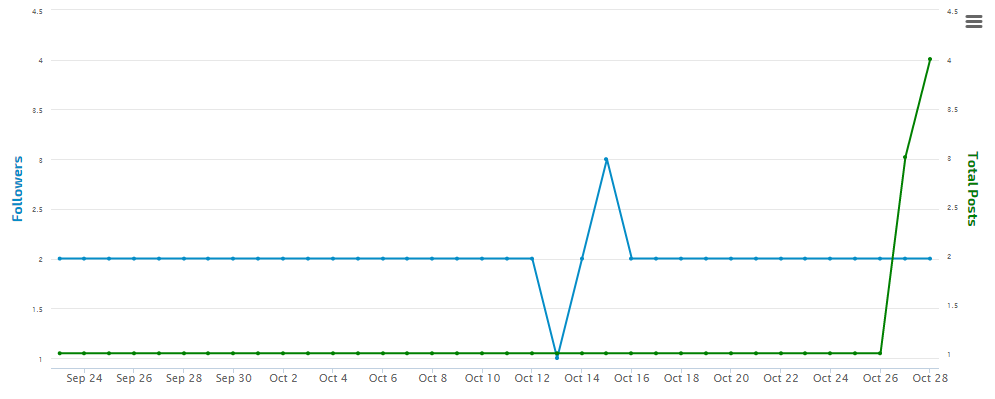
Instagram Image & Video KPIs
Graph and monitor trends in Instagram Followers, Following and Total Posts
Share Social Media Marketing Results
Combine social analytics Insight Graphs and reports, add a custom cover page and schedule PDF reports to be delivered automatically to multiple email addresses. Or for online interactive reporting you can add them to a white label Client Dashboard.
 The beauty of the Insight Graph is that you can make each graph uniquely yours by selecting from a designer color palette, a variety of chart types and extensive set of marketing performance metrics. If you happen to create a masterpiece that you're especially proud of, we hope you'll export it to an image or PFD file and send it to customer service so we can admire it as well.

Rank Ranger Updates
Similarweb Search Volumes Are Now in Rank Ranger
January 4, 2023
Announcing the Rank Ranger Google Analytics 4 Integration
August 10, 2022
A New Beginning with Similarweb: How Our Customers Will Benefit
May 25, 2022
Core Rank Tracking - A Local Enterprise SEO Tool
November 3, 2021
Announcing The SERPulator: A Free Meta Tags Preview Tool!
March 10, 2021
Subscribe & Receive Updates
Related Articles
Insight Graph Gets Fresh SERP Features Data
Join Together! LinkedIn Now Available on the Insight Graph
What is Google's Knowledge Graph?
Marketing Data Analysis: Getting a Fuller SEO & Marketing Picture
How to Create Knock-Out SEO Reports
SERP News: Abounding SERP Feature Data Changes